
In a world increasingly shifting towards renewable energies, efficiency and precision in the planning of photovoltaic projects are not only desirable, but absolutely necessary.
This is where the Photovoltaic Geographical Information System (PVGIS) comes in, an essential tool that has revolutionised the way professionals and amateurs alike can calculate the potential solar energy production of their installations.
Developed by the European Commission, PVGIS is a free online calculator that provides solar radiation data and detailed estimates of the energy that can be generated by photovoltaic systems in various geographical locations.
What is PVGIS?
PVGIS is more than just a solar calculator; it is an integrated system that allows users to evaluate the performance of PV systems based on various geographical and technological parameters. It provides access to a vast database including historical solar radiation data since 2005, allowing for highly accurate projections and comparisons over time.
This tool is not only accessible to experts in the field, but also provides an intuitive platform for beginners to understand and apply the basic principles of photovoltaics in their projects.
Basic operation of PVGIS
PVGIS, developed by the European Commission, is an online tool with high technical complexity, but with a user-friendly interface that allows users, whether experts or beginners, to accurately calculate the potential solar energy production of photovoltaic installations.
The functionality of PVGIS focuses on several key processes that together provide reliable and detailed estimates that are crucial for the planning and optimisation of solar projects. The main steps and features of the basic operation of PVGIS are detailed here:
Selection of the project location:
Every calculation in PVGIS starts with the selection of the geographical location of the PV system. Users can specify the location in several ways: by clicking directly on an interactive map, by entering latitude and longitude coordinates, or by using the search function to enter an address.
This flexibility ensures that the location of the project is accurately identified, which is essential for obtaining relevant solar radiation data.
Entering the data of the PV system:
Once the location has been established, users must provide specific details about the PV system they wish to assess. This includes:
- Type of installation: Determine whether the system will be grid-connected or a stand-alone system, and whether it will use solar trackers to adjust the orientation of the panels during the day.
- Panel technology: Specify the type of solar panel technology (such as crystalline silicon, CIS, or CdTe).
- Installed peak power (kWp): Enter the total peak power of the panels to be installed.
- Estimated system losses: Set the expected percentage of losses due to factors such as shading, soiling, inverter efficiency, etc.
Selection of the solar radiation database:
PVGIS provides access to multiple solar radiation databases covering different regions of the world. Users should select the database that best suits their location to ensure accurate radiation calculations. For example, the PVGIS-SARAH2 database is suitable for locations in Europe, while other databases may be more appropriate for the Americas, Asia or Africa.
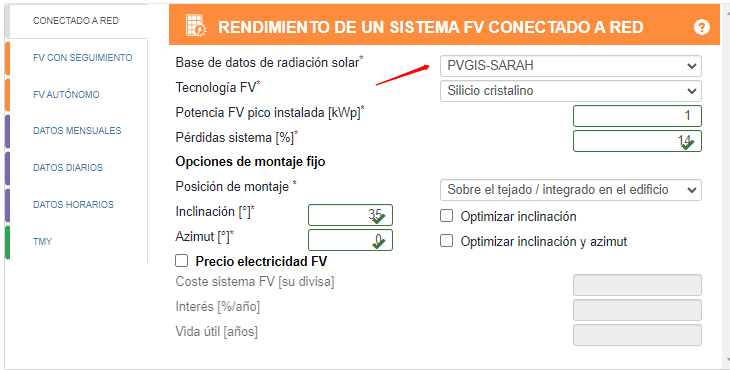
Mounting configuration and orientation of the panels:
One of the most critical aspects in the configuration of any photovoltaic system is determining the orientation (azimuth) and tilt of the solar panels. PVGIS facilitates this process through options that allow:
- Manually set tilt andyaw based on prior knowledge or expert recommendations.
- Use the PVGIS optimisation feature, which automatically calculates the ideal tilt and orientation to maximise energy production based on geographic location and other environmental factors.
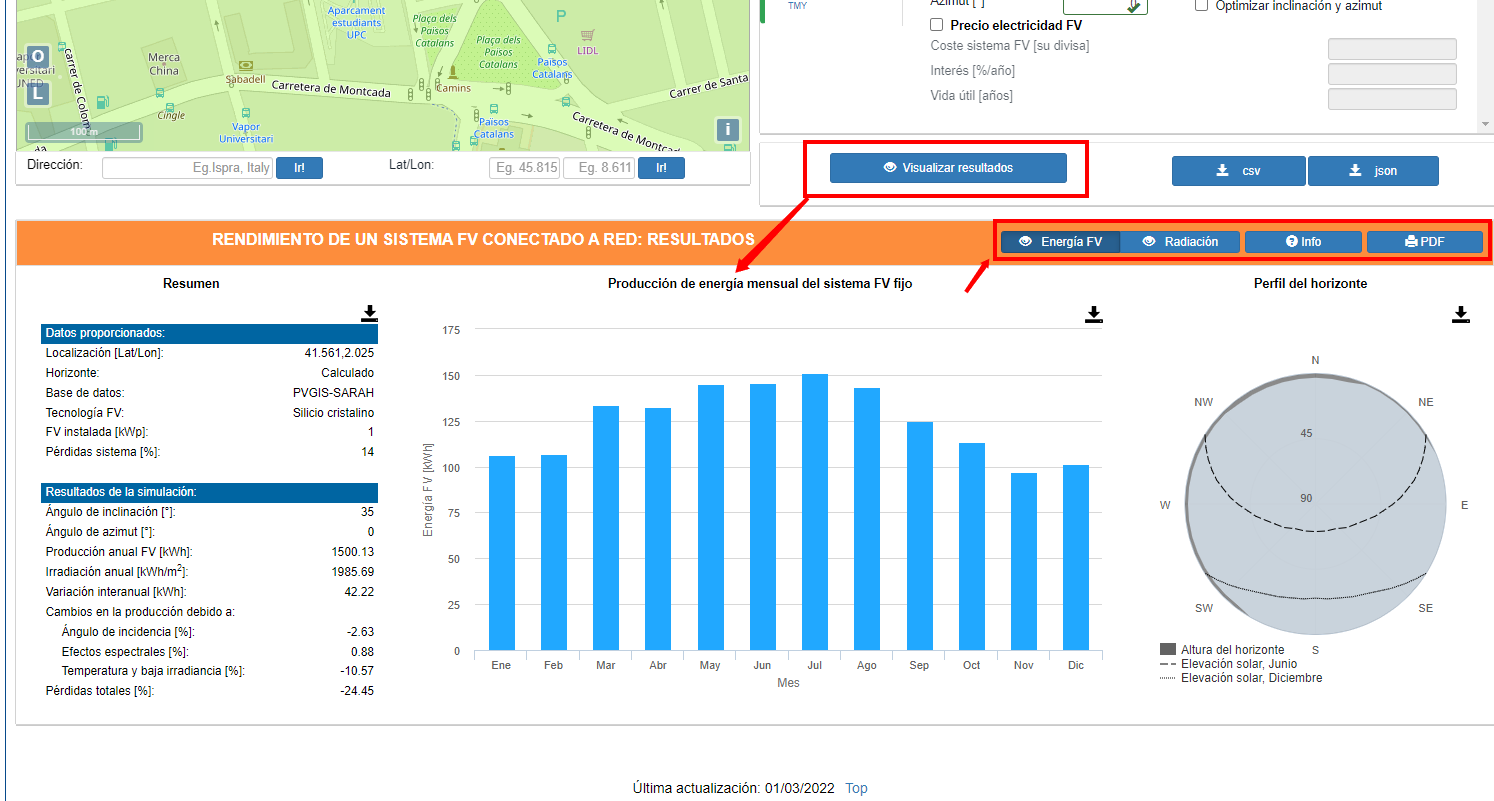
Visualisation and analysis of results:
After entering all the necessary data, PVGIS performs the calculations and provides a detailed visualisation of the results. These include estimates of monthly and annual energy production, which are presented in graphs and tables. In addition, users can download these results in various formats for further analysis or for inclusion in project proposals.
By integrating all of these capabilities into an accessible and easy-to-use interface, PVGIS allows users around the world to assess the potential of solar energy in their specific locations with remarkable accuracy and depth.
Advantages of using PVGIS
The PVGIS tool stands out in the field of solar energy because of several key advantages it offers users, from professionals to self-consumption enthusiasts. These advantages not only make the tool indispensable for the accurate and effective planning of photovoltaic installations, but also contribute to sustainable development by optimising the use of renewable energy resources.
Optimisation of the orientation and inclination of the solar panels:
PVGIS is invaluable for its ability to recommend the optimal orientation and tilt of solar panels, tailored specifically to the geography of any chosen location. This feature ensures that each installation can maximise its solar radiation capture, which is critical to increasing the energy efficiency of the system.
For example, the tool can suggest a different tilt for a location with high latitude compared to one closer to the equator, depending on the prevailing solar angles throughout the year.
Advanced shadow simulation and calculated horizon:
One of the most outstanding features of PVGIS is its ability to simulate the effect of shadows that other nearby objects may cast on the solar panels. This simulation helps to assess the real impact that shadows will have on solar energy production, allowing users to adjust the location or configuration of the panels to avoid efficiency losses.
In addition, the “Calculated Horizon” option uses topographic data to automatically adjust solar radiation calculations, providing a more accurate representation of the actual environment in which the panels will be installed.
Flexibility in the selection of solar radiation databases:
PVGIS offers several solar radiation databases, allowing users to choose the most suitable one according to their geographical location. These databases are up-to-date and highly accurate, ensuring that energy production calculations are as realistic as possible.
The availability of historical and current data also allows users to perform trend analysis and estimate variability in energy production over time.
Data download and ease of presentation:
Another significant advantage of PVGIS is the ability to download all calculation results in various formats, such as CSV or PDF. This is especially useful for professionals who need to present project proposals or feasibility reports to investors or interested parties.
The possibility to export the data facilitates the integration of the results into other documents and presentations, improving communication and understanding of the proposed PV projects.
Accessibility and ease of use:
PVGIS is a free and accessible online tool with no specialised software requirements, making it extremely convenient for anyone interested in solar energy, regardless of geographical location or technical expertise.
The user interface is intuitive and guided, making it easy to use even for those who are new to solar energy.
These advantages make PVGIS an essential and reliable tool for the evaluation and optimisation of photovoltaic projects, thus contributing to the effective and sustainable expansion of solar energy worldwide.
Frequently Asked Questions about PVGIS
Is PVGIS free of charge?
Yes, PVGIS is a free tool offered by the European Commission. It is designed to be accessible to any user interested in calculating the potential solar energy production.
Can I use PVGIS for any location in the world?
Yes, although PVGIS is specially designed with detailed data for Europe, it also provides solar radiation data and energy production estimates for locations all over the world using different databases.
What data do I need to use PVGIS?
You need the location of the solar installation, the type of solar panels, the peak power of the installation, and details about the system configuration such as the tilt and orientation of the panels. PVGIS also allows you to adjust additional parameters such as estimated system losses.
How can I improve the accuracy of PVGIS estimates?
Ensuring that all data entered is as accurate as possible, especially location, panel type, system configuration, and using the appropriate solar radiation database for your region. In addition, consider local environmental factors that could affect solar radiation, such as shading or nearby structures.
Does PVGIS also calculate the economic return of a solar installation?
Not directly. PVGIS is designed to estimate solar energy production. For economic return calculations, you will need to combine PVGIS production data with analyses of installation costs, maintenance and local energy prices.
Don’t wait any longer to invest in a sustainable and economically profitable solution that not only benefits your home, but also the planet.